Available child-level records
(1 for every U.S. child under the age of 12)

Help Families

CUSP creates a comprehensive profile for every child in the state, blending real-life information with enriched insights (Social Vulnerability Index and Child Opportunity Index).

Advantage: By modeling the entire child population of the state, not just those being served in programs, CUSP helps identify service gaps that exist in your state.  Children that are not being served are included in the data so that their eligibility can be considered and prioritized.

Learn More

Analyze Services

CUSP matches and integrates both child and provider level data. CUSP allows for flexible configuration of age and income requirements to align with state-specific eligibility criteria for early childhood programs and services. CUSP provides deep insight into how well your child population is being served over time from identification, through enrollment and attendance in early education programs.
Features

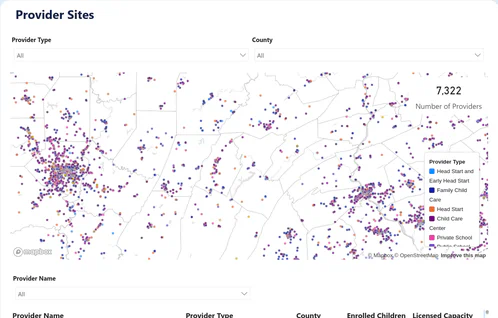
Identify child care deserts and shortages as well as the underlying context related to a community’s socio-economic health, as measured by their Child Opportunity Index 3.0 (COI) or Social Vulnerability Index (SVI).

Configurable by ratios of capacity to population, or utilizing the LISA method to identify extreme child care deserts.


Benefits

Helps identify communities that face not only child care capacity shortages bus also other socio-economic vulnerabilities that impact young children.

Identify high-need communities where families face income and child care capacity constraints.

Examine broad correlations between changes in policy or economic environment in a state and child care capacity in different communities, especially child care deserts.


Learn More

Evaluate Risk

CUSP Risk & Audit Analytics leverages CUSP’s powerful integrated data platform to quantify and measure the risk of potential non-compliance with program regulations (such as CCDF regulations) or administrative errors by child care providers.
Features

CUSP estimates scores based on a range of risk scenarios for all providers who receive public funding to identify violation red flags.

CUSP empowers state program administrators with a fair, unbiased, data-driven view of high-risk providers that can inform decisions and corrective actions with the goal of ensuring equitability, continuity, and quality of care for children and families.


Benefits

Flexible filtering to segment provider risk scores based on relevant, meaningful dimensions such as facility type, public program participation, licensed capacity, and location.

Detailed views of every provider and their current and historical scores provide crucial contextual information to support interpretation and decision-making.


Learn More

Evaluate Providers

CUSP establishes a unique chronologic record of every program and service at the provider site level in a state. This enhances understanding of provider teachers, quality, staffing, subsidy payments and assessment data. This is further enhanced by the CUSP Provider Churn Analytics Dashboard.
Features
CUSP enables users to track and analyze the dynamics of the provider landscape within their state, including trends in provider entry, exit, and changes in ownership (if this data is available from state sources), and compare these with historical trends.

Benefits
Empowers users to identify areas at risk of becoming child care deserts, i.e., communities with an acute shortage of licensed capacity to serve the children residing in them.

Communicate Effectively

Unlock the power of a story with our single-page fact sheet, designed to provide clear, actionable insights related to the child care landscape in a state and its communities. This product is designed to condense large amounts of CUSP data into a simple, digestible view, ideal for streamlined reporting and presentation. The Child Care Fact Sheet allows you to focus on what matters most without the clutter.
Features

The Child Care Fact Sheet is a printable, single-page view of high-level metrics that tell a story about providers and children in communities across a state.

Users can choose to view estimates at the state level or filter to focus on a specific geography within the state, for example, a county or a House or Senate legislative district.

Data includes easy-to-read visualizations of estimates of children and providers, such as the segmentation of children and providers along meaningful dimensions and the share of eligible children that are served by a state’s key publicly subsidized child care programs.


Benefits
The user-friendly format makes it easily accessible to a range of audiences, including research-focused users, agency program executives and leaders, and external audiences such as state legislators, policymakers, and other stakeholders, thus promoting broader understanding and engagement.

Engage Quickly

CUSP offers the advantages of flexibility, scalability, advanced analytics tools, easy collaboration, and cost-efficiency. Designed for implementation within states’ existing cloud environments, preserving state control over sensitive data. As the only true Early Childhood Integrated Data System (ECIDS) software provider, we can deploy our complete solution quickly and efficiently.

Learn More


Our Trusted Partners

Learn from us

We’ve compiled a collection of resources to help inform your work and improve outcomes for young children

CUSP Member Massachusetts 2024 Report

CUSP Member Georgia 2024 Report

Third Sector Intelligence 2024. Year in Review

Join us in our mission to make high-quality education and social services accessible to all children.

Get in Touch to Learn More